
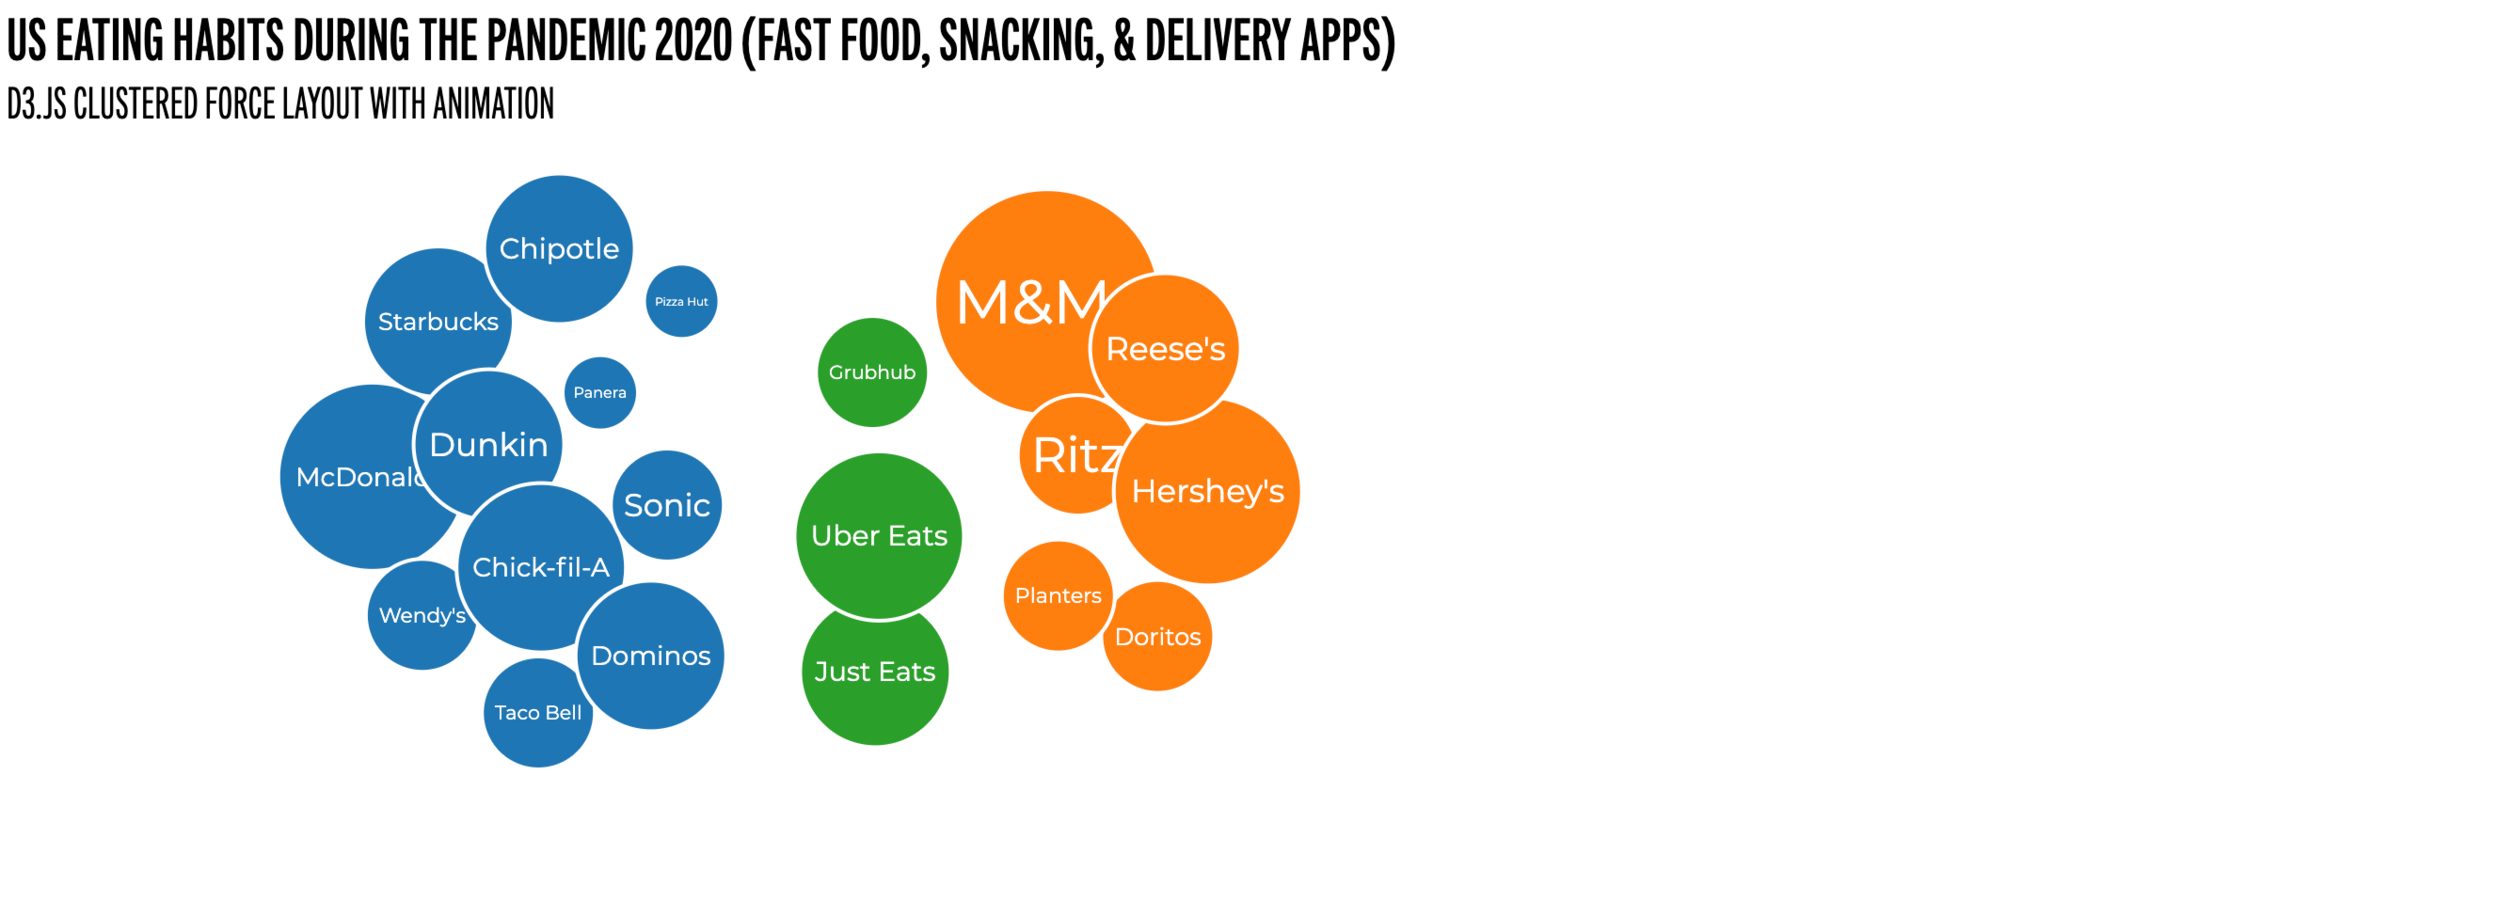
Clustered Force Layout: Pandemic Food
Circles allow to represent hierarchies and compare values. This visualization is particularly effective to show the proportion between elements through their areas and their position inside a hierarchical structure. In this instance at the beginning of the Pandemic there were increases in consumption of fast food, snacking, and delivery apps (NCBI).
Tools used: D3.js and Codepen
Languages used: HTML, CSS, JS
Resources:
https://d3js.org/d3.v3.min.js
https://www.ncbi.nlm.nih.gov/pmc/articles/PMC8052604/
Live view here.